Biology:Biological data visualization
Biology data visualization is a branch of bioinformatics concerned with the application of computer graphics, scientific visualization, and information visualization to different areas of the life sciences. This includes visualization of sequences, genomes, alignments, phylogenies, macromolecular structures, systems biology, microscopy, and magnetic resonance imaging data. Software tools used for visualizing biological data range from simple, standalone programs to complex, integrated systems.
State-of-the-art and perspectives
Today we are experiencing a rapid growth in volume and diversity of Biological Data, presenting an increasing challenge for biologists. A key step in understanding and learning from these data is visualization. Thus, there has been a corresponding increase in the number and diversity of systems for visualizing biological data.
An emerging trend is the blurring of boundaries between the visualization of 3D structures at atomic resolution, visualization of larger complexes by cryo-electron microscopy, and visualization of the location of proteins and complexes within whole cells and tissues.[1][2]
A second emerging trend is an increase in the availability and importance of time-resolved data from systems biology, electron microscopy[3][4] and cell and tissue imaging. In contrast, visualization of trajectories has long been a prominent part of molecular dynamics.
Finally, as datasets are increasing in size, complexity, and interconnectedness, biological visualization systems are improving in usability, data integration and standardization.
List of visualization softwares
Many software systems are available for visualization biological data.[5][6][7][8] The list below links some popularly used software, and systems grouped by application areas.
- Medusa - A simple tool for interaction graph analysis.[9] It is a Java based application and available as an applet.
- Cytoscape - An open source software for integrating bio-molecular interaction networks with high-throughput expression data and other molecular states.[10]
- Proviz - ProViz is a standalone open source application under the GPL license.[11]
- PATIKA - It is a tool with integrated visual environment for collaborative construction and analysis of cellular pathways.[12]

Genomic and assembly data
Alignments, phylogeny and evolution
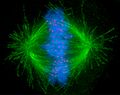
Microscopy


References
- ↑ "Structural studies by electron tomography: from cells to molecules". Annual Review of Biochemistry 74: 833–65. 2005. doi:10.1146/annurev.biochem.73.011303.074112. PMID 15952904.
- ↑ "The future is hybrid". Journal of Structural Biology 163 (3): 186–95. September 2008. doi:10.1016/j.jsb.2008.06.002. PMID 18602011.
- ↑ "Sub-Second Cellular Dynamics: Time-Resolved Electron Microscopy and Functional Correlation". A Survey of Cell Biology (Submitted manuscript). International Review of Cytology. 255. 2006. pp. 133–76. doi:10.1016/S0074-7696(06)55003-X. ISBN 9780123735997. http://nbn-resolving.de/urn:nbn:de:bsz:352-opus-40380.
- ↑ "Time-resolved imaging of macromolecular processes and interactions". Journal of Structural Biology 147 (3): 209–10. September 2004. doi:10.1016/j.jsb.2004.06.003. PMID 15450290.
- ↑ "Visualizing genome and systems biology: technologies, tools, implementation techniques and trends, past, present and future". GigaScience 4: 38. 2015. doi:10.1186/s13742-015-0077-2. PMID 26309733.
- ↑ "A survey of visualization tools for biological network analysis". BioData Mining 1: 12. November 2008. doi:10.1186/1756-0381-1-12. PMID 19040716.
- ↑ "A reference guide for tree analysis and visualization". BioData Mining 3 (1): 1. February 2010. doi:10.1186/1756-0381-3-1. PMID 20175922.
- ↑ Interpreting the Omics 'era' Data. Smart Innovation, Systems and Technologies. 25. 2013. 79–100. doi:10.1007/978-3-319-00375-7_6. ISBN 978-3-319-00374-0.
- ↑ "Medusa: a simple tool for interaction graph analysis". Bioinformatics 21 (24): 4432–3. December 2005. doi:10.1093/bioinformatics/bti696. PMID 16188923.
- ↑ "Cytoscape: a software environment for integrated models of biomolecular interaction networks". Genome Research 13 (11): 2498–504. November 2003. doi:10.1101/gr.1239303. PMID 14597658.
- ↑ "ProViz: protein interaction visualization and exploration". Bioinformatics 21 (2): 272–4. January 2005. doi:10.1093/bioinformatics/bth494. PMID 15347570.
- ↑ "PATIKA: an integrated visual environment for collaborative construction and analysis of cellular pathways". Bioinformatics 18 (7): 996–1003. July 2002. doi:10.1093/bioinformatics/18.7.996. PMID 12117798.
External links
Related conferences
- BioVis: Symposium on Biological Data Visualization
- Applications of Information Visualization in Bioinformatics
- CIBDV: Computational Intelligence for Biological Data Visualization
- IVBI: Information Visualization in Biomedical Informatics Symposium
- VMLS: Visualization in Medicine & Life Sciences
- VIZBI: Workshop on Visualizing Biological Data
 |  |

