 |
Technology, Computation and Data Analysis |
How to write a book using Google Docs
February 21, 2024 Reading time: 2 minutes
Recently, I've posted some instructions about how to write a book using Google Docs. I just wanted to share my experience with this approach of creating large books. Now I'm writing a new book and I had to learn quite a lot about how to do this in Google Docs.
Can a human brain hold your life experience?
February 21, 2023 Reading time: 6 minutes
A human brain is an amazing instrument. It combines huge data storage with massive real-time processing. According to Scientific American [1], the memory capacity of the human brain was reported to have the equivalent of 2.5 petabytes (2500 TB) of memory capacity. This number was obtained by estimating how much information can be stored by 125 trillion synapses in the cerebral cortex.
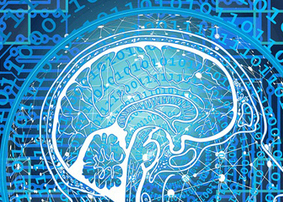
(credits to pixabay.com)
Recent Java enhancements for numeric calculations
February 21, 2023 Reading time: 3 minutes
In the past, slow evaluation of mathematical functions and large memory footprint were the most significant drawbacks of Java compared to C++/C for numeric computations and scientific data analysis. However, recent enhancements in the Java Virtual Machine (JVM) enabled faster and better numerical computing due to several enhancements in evaluating trigonometric functions.
The Era of Centralized Social Media Is Over
February 21, 2023 Reading time: 6 minutes
For too long, we have made what has amounted to a Faustian bargain. If you post your comments, your pictures, your videos, your essays, your reviews—your content—on Big Tech’s enormous centralized platforms, then Big Tech will give you free hosting, an audience if you compete well, and some content development tools. It seemed fair. At least, that is how they encourage you to think about this bargain.
New EncycloReader version 2.0
February 21, 2023 Reading time: ~1 minute
New EncycloReader version 2.0 is available (https://encycloreader.org):
-
Now it allows reading articles even when Wikipedia and other encyclopedias are blocked by some country/organization, or when they are down due to some technical reasons. This functionality works for 1.5 million most popular articles in the ZWI format.
-
This version includes automatic language detection using elements of artificial intelligence.
-
Currently EncycloReader serves 33 encyclopedias with different publication policies in 12 languages. Searches can be done in 30 million articles.
S.Chekanov (for KSF)
Statistics and simulation show that wealth is just pure luck
February 21, 2022 Reading time: ~1 minute
A recent article "Talent vs. Luck: The Role of Randomness in Success and Failure" published in Advances in Complex Systems Vol. 21, No. 03n04, 1850014 (2018) (arxiv.org/abs/1802.07068) shows that, according the a new computer model of wealth creation, the most successful people are not the most talented, just the luckiest. The developed computer model accurately reproduces the wealth distribution in the real world. One of the most important conclusions of this simulation is that the wealthiest individuals are not the most talented (although they must have a certain level of talent). They are the luckiest.
New version of EncycloReader
February 21, 2022 Reading time: 2 minutes
New version (1.6) of https://encycloreader.org for reading encyclopedias of the EncycloSphere project is released. This is another milestone to create a resource that allows searches in about 7.5 million articles from encyclopedias with different publication policies.
Encyclone search engine is launched
February 21, 2022 Reading time: 2 minutes
Encyclone (http://encyclone.org/) is a web application for crawling, indexing and searches of online encyclopedias. Search can be performed in more than 40 encyclopedias with different publication policies. English is the primary language of the included encyclopedias.
An encyclopedia for technicians
February 21, 2021 Reading time: ~1 minute
Software developers need to be knowledgeable, creative and innovative in order to succeed in the field, while data scientists use software technology to have insights into large amounts of data they collect. Here is a recent article that can be useful for those who are looking for encyclopedic references to be used in the tech sector (including software development). The article is called HandWiki – an encyclopedia for technicians posted to JobSearchUniverse.com (Career advice) (published on May 24, 2021).
Stunning 3D visualization with JavaView
February 21, 2021 Reading time: 3 minutes
JavaView (http://www.javaview.de/) is a 3D geometry viewer and a mathematical visualization software known since 90x. The program is written in Java, and enables a smooth integration into commercial software like Mathematica and Maple. JavaView can be used for 3D scientific visualization, geometric modeling, variational optimization, vector fields etc.
List of most popular scientific software written in Java
February 21, 2021 Reading time: 12 minutes
Love Java? Here is the most popular Java programs:
Largest online encyclopedia of physics, math and computing
February 21, 2020 Reading time: ~1 minute
In 2020, HandWiki (https://handwiki.org/) has become the largest online wiki encyclopedia of natural sciences and computing. It has more than 105,000 scholarly articles, incorporating the current Wikipedia articles on many research topics, scholarly articles submitted to the Wikipedia foundation, and various wiki books.
Wikipedia alternatives you should know about
February 21, 2020 Reading time: ~1 minute
Wikipedia remains the world"s biggest information resource used by communities of volunteers. Most of the other encyclopedic resources are smaller in size but, compared to Wikipedia, they are designed for specific areas of expertise and, typically, are maintained by non-for-profit organizations or persons with significant knowledge of specific topics. In many cases, they also have alternative publication policies for accepting online content, as well as the dispute resolution policies which have become increasingly important for the resources edited by large communities of experts.
Wikis for publishing scholarly articles on data science and software
February 21, 2019 Reading time: 4 minutes
By now you may already know that to add scholarly articles to the English version of Wikipedia is difficult due to the "notability" concept and tight control from anonymous editors (see this article). In recent years, entire Wikipedia topics and articles dedicated to software and data science have been wiped out by a few nameless characters without clearly-indicated scientific credentials. Their user pages are usually empty, and their login names tell nothing. That"s right - the "notability" of articles on Wikipedia is enforced by unnotable editors. This casts significant doubts on their ability to make correct decisions, and on the entire notability concept of wiki-style resources.
jPort - desktop menu to access free portable Java applications
February 21, 2019 Reading time: ~1 minute
jPort is finally out (and it is already release 1.4!). What is special about jPort project? jPort is a portable application launcher for Java-enabled platforms (Windows, Linux, Mac). It can launch dozens of free Java-powered programs for office, science, education, code development, entertainment and graphics.
Restored Wikipedia articles
April 22, 2018 Reading time: ~1 minute
About 15,200 scholarly articles permanently removed from Wikipedia in 2018 and 2019 have been restored by the Handwiki team. In 2018 and 2019, such articles did not pass the Wikipedia"s notability. As the result of this, a lot of useful content was lost. Articles on software programs and computing were the most affected by this Wikipedia trimming.
Currently the restored Wikipedia articles on computing, science and education can be found in HandWiki (https://handwiki.org). These articles cover the following topics:
- data analysis and mathematics
- software programs and libraries
- physics, astronomy and technology.
submitted by S.Chekanov
Using Multi-Layer Recurrent Neural Network for language models
February 22, 2018 Reading time: ~1 minute
Here is another example of how to use Multi-Layer Recurrent Neural Network (RNN package) designed for character-level language models. This neural network was trained using 165,000+ real titles of acts submitted to the Congress from CONGRESS.GOV. The training was performed using GPU. Then the trained RNN was used to create "fake" titles. Use this link to find which bill title is real and which is created by RNN.
This example of the RNN package is provided by Jahred Adelman (NIU).
Popularity of software programs for data science using recent reviews
February 21, 2018 Reading time: 16 minutes
In this article we will analyze the popularity of various software programs designed for data analysis using recently published reviews. These articles and blogs were written in the last two years, covering a wide range of software tools written in C++, Java and Python. Such programs are designed for data analysis, data mining, statistics and data visualization. Here is the list of articles used in our analysis of popularity of such software tools:
Popularity of programming languages in 2016
February 21, 2018 Reading time: 2 minutes
According to TIOBE Index for January 2016, the Java popularity index again has reached 21%, leaving behind C++ (6%), while Python index is only 3.8%. These numbers can be different for data analysts positions, of course, where Python is likely to be more popular than Java.
JTerm - Linux commands for Windows?
February 21, 2018 Reading time: ~1 minute
JTerm is an attempt to mimic Linux/Unix commands using 100% Java. Thus it works on Windows. This project is its infancy, but it is already very useful. For some, it may also look also more attractive than using Cygwin on Windows. First thing to notice - it is only 3M in size, a tiny program compared to the default Cygwin installation. Secondly, it has nice look and feel thanks to Nimbus L&F. In combination with JPort portable Java desktop, it may lead to interesting alternative to Cygwin.